Back to the index · Previous: Silver: Apply changes
This chapter covers what a notebook is, its cell types, the first-line options (%sql, %python, %md …), Markdown, and everything you do in the notebook screen. Three chapters go deeper:
- 7a · Spark: the engine that runs your cells.
- 7b · SQL reference: every SQL command you can use, with examples.
- 7c · Python reference: PySpark and the DataSimple helpers.
Streaming and continuous loads are in 7d · Streaming, materialized views and incremental tables.
What a notebook is#
A notebook is a page of cells. Each cell holds SQL, Python or text (Markdown). You run a cell and its result appears under it: a table of rows, a chart, or printed output. Notebooks are where you explore data, build Silver and Gold tables, and write the transformations that pipelines and schedules later run for you.
- Where cells run. SQL and Python cells run on Spark, the engine of your lakehouse (chapter 7a). Each user has their own Spark session; all the Python cells of a notebook share it, so a variable set in one cell is there in the next.
- One name for every table. SQL and Python see the same tables by catalog name:
datasimple.<layer>.<table>,<layer>.<table>, or a bare table name. Layers aresource,bronze,silverandgold. - Your access applies. Reads by name are governed: your grants, row filters and column masks are applied, and the read is recorded in Lineage.
- What you write is registered. Writes through SQL (
CREATE TABLE,MERGE,INSERT) or the helpers (save_table,merge_delta) register the table in the catalog and record lineage. A plaindf.writeto a storage path does neither. - Nothing is lost. Every save keeps a version of the notebook; every cell run writes a line to the Log.
Your first notebook#
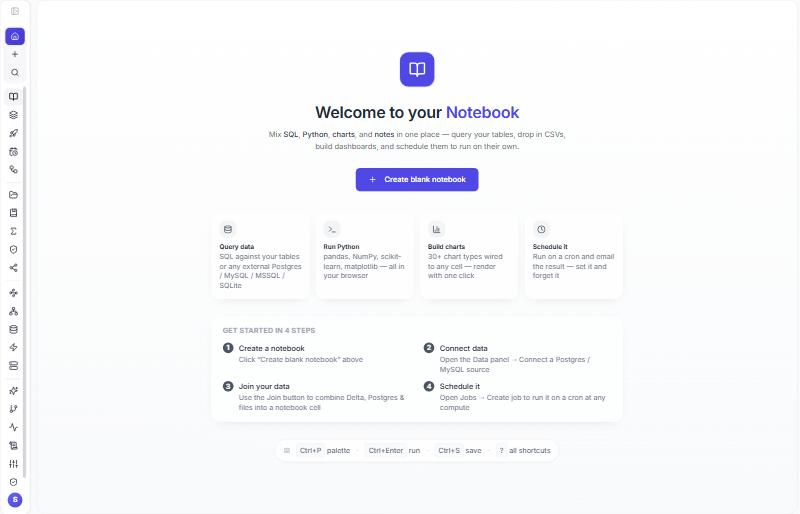
- Left rail → Notebooks → + Create blank notebook (optionally inside a folder). Give it a name.
- In the first cell, type:The cell becomes a Markdown cell; theText
%md ## Orders by status Source: the Bronze copy of the orders table.%mdline disappears. - Add a cell (the + under the cell) and type:Press Ctrl+Enter. The rows show under the cell, with Chart, Pivot and Quality tabs.Text
%sql SELECT Status, COUNT(*) AS orders FROM bronze.dbo_Orders WHERE NOT _is_deleted GROUP BY Status ORDER BY orders DESC - Add another cell:The printed line shows first; the last line, a DataFrame, shows as a table.Text
%python orders = read_table("bronze.dbo_Orders") print(orders.count(), "rows") orders.groupBy("Status").count() - Press Ctrl+S to save. Run all in the toolbar runs every cell from the top.
Use your own table names: right-click a table in the Lakehouse tree and choose Insert read to get its name in a cell.
Cell types#
Choose the type in the drop-down at the top left of the cell, or type a first-line option (next section).
| Type | Runs where | What it is for |
|---|---|---|
| SQL | On the Lakehouse, or on one of your Data Sources when Query a source system is on (see Where SQL runs) | Queries, CREATE TABLE … AS, MERGE, APPLY CHANGES, materialized views, COMMENT ON, grants. Results show as a table with Chart, Pivot and Quality tabs. See 7b. |
| Python | On Spark, in your notebook session | PySpark and the DataSimple helpers (read_table, save_table, ds.*, check_table …). See 7c. |
| Markdown | Not run | Headings, notes, tables and links between the code cells |
| Parameters | Not run | Named values (text, number, date, or a pick list) that SQL cells use as {{name}} and Python cells use as variables. Schedules and pipeline steps can pass their own values |
| Chart | Not run | A bar, line or other chart drawn from another cell's result |
| Shell | On Spark, as a shell command | One-off commands (ls, head); the output prints under the cell |
| Scala, R | On Spark, in a language session of their own | Only when your administrator has enabled these languages |
The badge next to the type tells you where a cell runs: Cluster for Python on Spark, LAKEHOUSE for a SQL cell on the Lakehouse, or the Data Source's name for a SQL cell on a source system.
First-line options: %sql, %python, %md#
Type an option on the first line of a cell and the cell switches to that type. The option line is removed, so it never reaches Spark. Upper or lower case both work, and %% works the same as %.
| First line | Cell becomes | Also accepted |
|---|---|---|
%sql |
SQL | %%sql |
%python |
Python | %py, %%python |
%pyspark |
Python on Spark | %spark |
%md |
Markdown | %markdown |
%sh |
Shell | %shell |
%scala |
Scala | |
%r |
R |
Only the first line counts: a %sql on line 3 is ordinary text (and a SQL error). Pasting a cell from another notebook tool that starts with one of these lines does the right thing.
Options that other notebook tools have and DataSimple does not: %run (run another notebook: use a pipeline with one step per notebook), %pip (packages are installed by your administrator), %fs (read files through tables, or read_parquet / read_delta in Python) and %scala/%r unless enabled.
Markdown cells#
Markdown cells have a toolbar (bold, italic, code, link, image, headings, list, quote) and Show preview. What renders:
| Write | Shows as |
|---|---|
# Title, ## Section, ### Sub-section |
Headings (three levels) |
**bold**, *italic* |
bold, italic |
`code` |
code |
- item or * item |
Bullet list |
> note |
Quote |
[text](https://…) |
Link (opens in a new tab) |
 |
Image |
| A pipe table with a ` | --- |
## Retail: net sales by region

Source: **Retail sales** business view. Numbers are after line discounts, before returns.

| Region | Owner |
|---|---|
| West | Ana |
| South | Raj |

> Run the parameter cell first.
Not supported: numbered lists, fenced code blocks and HTML. Use bullets, inline code and a separate SQL or Python cell instead.
Running cells and the notebook menu#
| Keys or button | Does |
|---|---|
| Ctrl+Enter (⌘+Enter on a Mac) | Run the current cell |
| Shift+Enter | New line inside the cell (it does not run) |
| Run all | Run every code cell from the top, in order; stops at the first failing cell |
| Stop | Stop the running cell |
| Ctrl+S | Save the notebook (and keep a version) |
| Ctrl+P | Command palette (every notebook action by name) |
The notebook menu (⋯): View diff vs. saved, Version history…, Query history…, Audit log…, Git…, Share…, Schedule…, Export .ipynb, Export HTML, Delete.
Results. A result shows up to 200 rows by default (Settings can raise the preview for reads answered by the SQL engine). CSV and Excel download the rows shown; for more rows, write the result to a table. Numbers show with the workspace's decimal places; load-time columns show in the workspace time zone. Share with Sarah saves a result as a Gold table with its own business view, so Sarah can answer from it.
Collapse and resize cells#
- Collapse a cell. Click the arrow at the far left of the cell header. The cell folds to one line showing its first line of code and its last result, for example "✓ 200 rows". Click the arrow or that line to open it again.
- Make the code box taller. Drag the grip at the bottom-right corner of the code box. Double-click the grip to fit all the code.
- Make the results taller. Drag the grip at the bottom-right corner of the results table. Double-click it to go back to the default size.
The notebook remembers each cell's collapsed state and sizes when it is saved.
SQL cells#
SELECT * FROM datasimple.source.dbo_Orders_DELTA LIMIT 20;

CREATE TABLE IF NOT EXISTS datasimple.bronze.nation_eu (
  nation_id BIGINT, nation STRING, region_id BIGINT, PRIMARY KEY (nation_id)) USING DELTA;

MERGE INTO datasimple.bronze.nation_eu t
USING (SELECT N_NATIONKEY AS nation_id, N_NAME AS nation, N_REGIONKEY AS region_id
       FROM datasimple.source.TPCH_SF1_NATION_DELTA WHERE N_REGIONKEY = 3) s
ON t.nation_id = s.nation_id
WHEN MATCHED THEN UPDATE SET *
WHEN NOT MATCHED THEN INSERT *;

DESCRIBE HISTORY datasimple.bronze.nation_eu;                   -- Delta versions
SELECT * FROM datasimple.bronze.nation_eu VERSION AS OF 0;      -- time travel by version
SELECT * FROM datasimple.bronze.nation_eu TIMESTAMP AS OF '2026-10-16 18:58:10';
SELECT snapshot_id, committed_at FROM datasimple.source.dbo_Orders_ICEBERG.snapshots;   -- Iceberg

DROP TABLE datasimple.bronze.nation_eu;          -- soft drop: files kept, UNDROP TABLE restores; add PURGE to delete files
Rules: the primary key is enforced on SQL writes (a duplicate key is rejected and rolled back), CREATE TABLE … USING DELTA with a column list and CREATE TABLE … AS SELECT create a managed table and register it, USING ICEBERG needs Iceberg enabled on the server, GRANT / REVOKE are recorded in Unity Catalog (not sent to Spark), path queries such as delta.`s3a://…` are refused for non-administrators. Scheduled and pipeline runs apply the same rules as the editor.
Every table a cell writes carries _tenantid (the tenant that wrote it): the write helpers and CREATE TABLE … AS SELECT add it when missing, and no cell may drop, rename or retype it (see Audit trail columns).
Where SQL runs: Lakehouse or a source system#
A SQL cell runs on the Lakehouse unless you choose otherwise. The notebook header shows Lakehouse with a switch next to it, Query a source system:
- Off (default): SQL cells run on the Lakehouse, the governed lake tables. Each SQL cell's badge reads LAKEHOUSE.
- On: a list of all your Data Sources opens, grouped by kind (Databases, Cloud warehouses, Business apps, Streams, Files & storage) with the engine next to each name. Type to search; the sources you used recently are at the top. Two sources with the same name show their number, for example
RETAIL_WebEvents · DS-21. Pick one and the SQL cells run on that system; their badge shows its name, for example CDCDEMO-SQL. Click the name to pick another; turn the switch off to go back to the Lakehouse.
Some sources are listed but greyed, because a cell can't query them directly. The list says how to use them instead: a Kafka source is read in a Lakehouse cell with STREAM KAFKA('DS-20', '<topic>') (see 7d), and a file drop or a storage target is loaded with Databridge and then queried in the Lakehouse.
The notebook remembers its source the next time you open it in this browser.
Combine sources#
To join or union data from more than one place in one SQL cell, click the Combine button (database icon) at the top right of the cell. Each slot reads either the Lakehouse or one of your Data Sources, under an alias (t1, t2, …). Slot 1 starts on the Lakehouse and slot 2 on the Data Source you used most recently. Drag a table onto a slot, or write the slot's SQL yourself, then write the combine query below using the aliases as table names:
-- slot t1 (Lakehouse):       SELECT * FROM bronze.dbo_Orders LIMIT 5
-- slot t2 (CdcDemo-SQL):     SELECT TOP 5 * FROM dbo.Orders
SELECT 'lake' AS side, COUNT(*) AS order_rows FROM t1
UNION ALL
SELECT 'source', COUNT(*) FROM t2;
Slots only read (SELECT or WITH). The badge reads COMBINED SOURCES. Disable turns the cell back into a normal SQL cell.
Fast queries#
A read on lake tables, such as SELECT … FROM datasimple.silver.orders, a join of catalog tables, DESCRIBE TABLE or SHOW TABLES, is answered by the always-on SQL engine in about a second, even right after you sign in, while your notebook session is still asleep. Your grants, row filters, column masks and masking apply exactly as they do in the session. Python cells, writes, time travel, temporary views, file paths, src. connections and anything else run in your notebook session as before. The run log shows warm SQL engine when a cell was answered this way, or warm SQL engine skipped with the reason when it went to your session.
Python cells#
Python cells have spark and the helpers. Two do most of the work: read_table("<name>") returns a Spark DataFrame with your permissions applied, and save_table(df, "<layer>.<name>") writes a Delta table and registers it.
orders = read_table("datasimple.source.dbo_Orders_DELTA")       # governed read
live = orders.filter("NOT _is_deleted")
scored = live.withColumn("big", F.col("Amount") > 1000)

save_table(scored, "silver.orders_scored")                        # creates or replaces the Delta table
merge_delta("silver.orders_scored", scored, on=["OrderID"])       # or merge by key
| Helper | Purpose |
|---|---|
read_table(name) |
governed read; resolves Parquet, Delta or Iceberg from the catalog |
read_delta_at(name, version=None, timestamp=None) |
Delta time travel |
list_delta_history(name, limit=20) |
Delta history as rows |
save_table(df, name, mode="overwrite", partition_by=None, merge_schema=False, fmt=None) |
Delta (or fmt="iceberg"), registered, quarantine rules applied, lineage recorded |
merge_delta(target, source_df, on, when_matched="update_all", when_not_matched="insert_all") |
Delta MERGE |
write_delta(df, name, mode="append", partition_by=None, replace_where=None, merge_schema=False, expect=None) |
Delta write with optional expectations |
ds.apply_changes(...), ds.apply_changes_from_snapshot(...), ds.create_target_table(...), DS Tables: @ds.table / ds.expect / ds.read / ds.run() |
chapter 15, DS Tables |
check_table(name, checks), profile_table(name), table_freshness(name), suggest_checks(name) |
Data Quality (chapter 9) |
grant(privilege, on, principal), revoke(...) |
governance, administrators or MANAGE holders |
optimize_table(name), drop_table(name) |
compaction, drop (files purged only under the managed root) |
read_share(share, table) |
a DataShare table you may read |
hist = list_delta_history("silver.orders_scored")                       # version, timestamp, operation, …
before = read_delta_at("silver.orders_scored", version=0)               # or timestamp="2026-10-16 18:58:10"
pdf = read_table("silver.orders_scored").toPandas()                     # pandas when you prefer it
print(pdf.groupby("big")["OrderID"].count())
Autocomplete: in a SQL cell, datasimple. offers the catalog's schemas (source, bronze, silver, gold, foreign, information_schema), datasimple.<schema>. or <schema>. the tables and views of that schema with their format (DL, IC, PQ, VIEW), and <table>. or <alias>. the columns with their types; with no dotted path you get keywords, Spark SQL functions with signature and a one-line description, and the Delta statements (DESCRIBE HISTORY, RESTORE TABLE … TO VERSION AS OF, MERGE INTO … WHEN MATCHED, APPLY CHANGES INTO … KEYS … SEQUENCE BY …) as fill-in snippets. In a Python cell the helpers above complete with their signature and docstring (also on hover and as parameter hints while you type the call), ds. lists the namespace, and inside the string of read_table(, save_table(df, , merge_delta(, ds.read(, ds.apply_changes(target= / source= you get the catalog's table names, information_schema.<view> included. The table list comes from the catalog and refreshes when the Catalog panel does or after a cell writes a table.
Insert read from the Lakehouse tree#
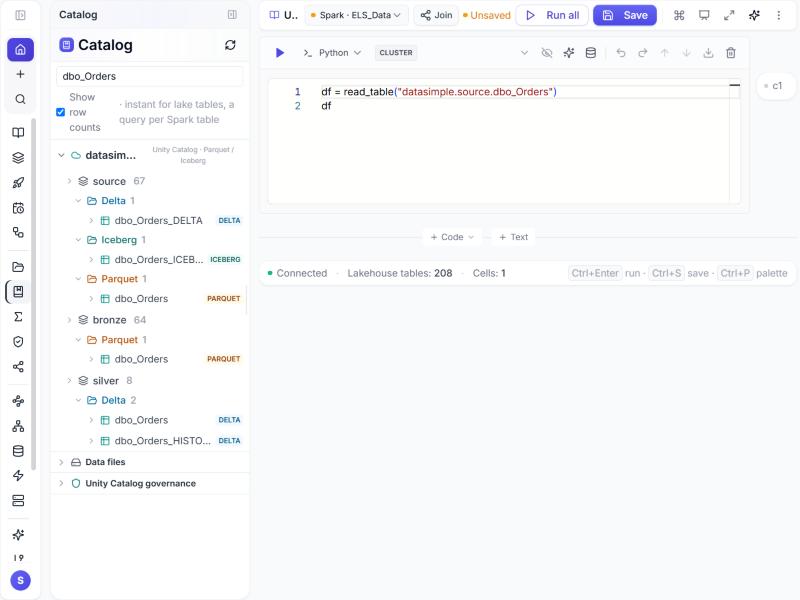
Open Lakehouse, right-click any table, Insert read: the cell that appears uses the catalog name, whatever the format underneath (SELECT * FROM … LIMIT 100 in a SQL cell, read_table("…") in a Python cell). You never type a bucket or a folder. An older cell that still contains a full storage path keeps working but is resolved to the registered table and read the same governed way; messages show the lake root as s3lake/..., never the bucket.
Parameters#
Add a Params cell at the top and declare values there, for example region_id = 3. Python cells use the variable; SQL cells write {{region_id}}. A job or a pipeline run can give different values, so one notebook serves many regions or dates. A placeholder with no value stops the cell with Parameter {{region_id}} has no value.
SELECT * FROM datasimple.source.TPCH_SF1_NATION_DELTA WHERE N_REGIONKEY = {{region_id}};
Charts#
Run a SQL or Python cell that returns rows, add a Chart cell under it, pick the type and the columns. The chart refreshes on every run, scheduled runs included.
Schedule a notebook as a job#
- Make sure Run all succeeds once.
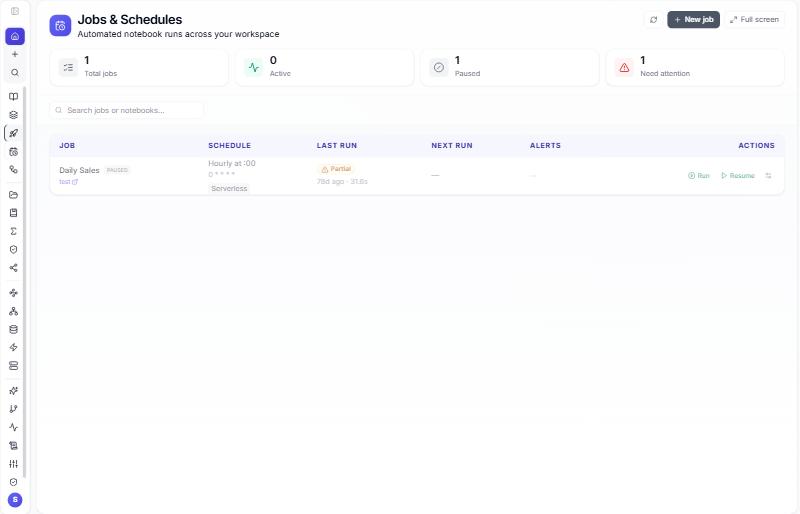
- Left rail → Schedules → + New job (or notebook menu → Schedule…): notebook, name, a preset or a cron (
0 2 * * *), timezone, parameters, retry count, email or webhook notifications. Create. - The row shows last and next run; Run runs it now; the pause button stops the schedule without deleting it; Manage opens the job's own run list.
A scheduled run executes every cell top to bottom exactly as Run all, with the parameters you gave; if a cell fails the run stops and is marked failed, and the retries start after 1, 5 and 15 minutes. Make the notebook self-contained: read everything with read_table or SQL inside it, use Params for values.
POST /api/notebooks/12/schedules
{ "name": "Daily run", "cronExpression": "0 6 * * *", "timezone": "UTC", "retryCount": 3, "parameters": { "region_id": 3 } }
POST /api/notebooks/12/schedules/:sid/run-now
GET  /api/notebooks/12/runs
GET  /api/notebooks/jobs                        -- every schedule in the tenant
POST /api/notebooks/spark/run-notebook          { "notebook_id": 12 }    -- headless run, stop on error
Kinetic pen#
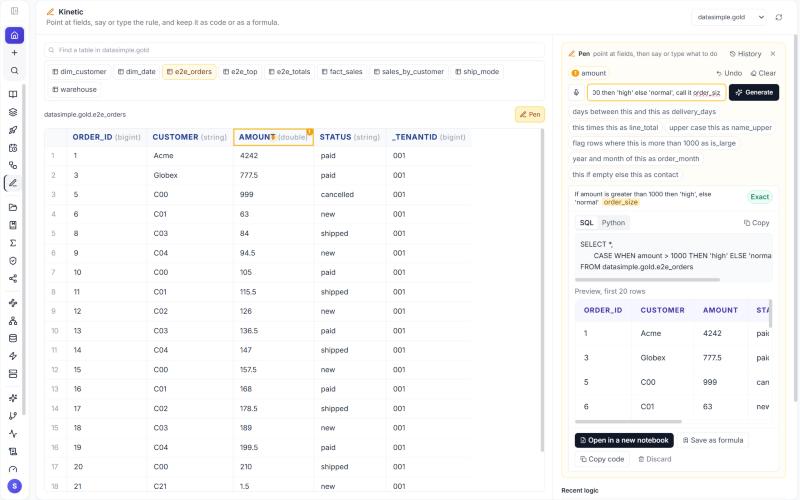
The pen turns pointing and a short sentence into a new column, a filter or a total. You don't write any code. Switch the result grid (or a table preview) to pen mode, point at the columns or cells you mean, and say or type what to do. You get back:
- the business rule in plain words, for example Days from ship_date to delivered_at,
- the expression in Spark SQL and in Python,
- the full code for a new cell. A SQL cell's statement becomes a subquery (
SELECT *, … FROM (<your SQL>) AS _k). A table is read asdatasimple.<layer>.<table>orread_table("<layer>.<table>"), - a preview of the new values on the sample rows already on screen.
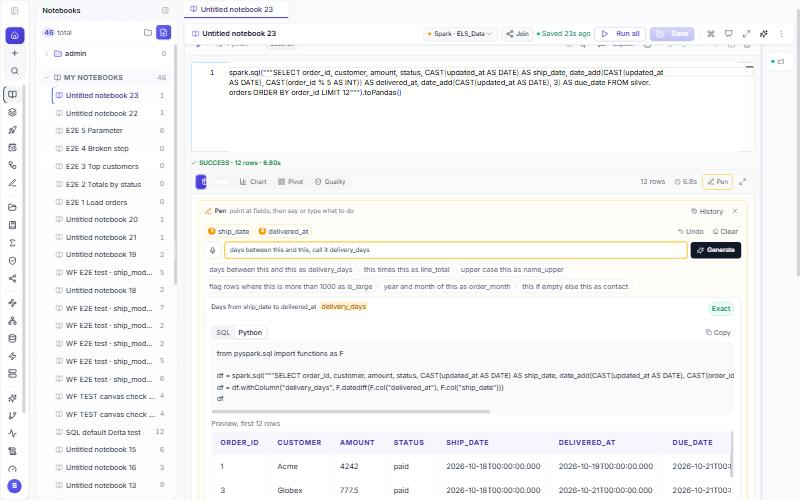
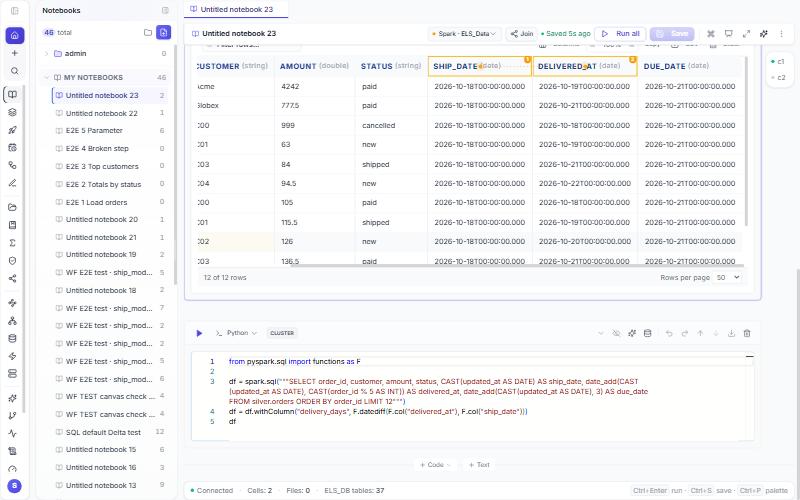
A Python cell that ends in spark.sql("""...""") or any expression is captured as df in the generated code, so the inserted cell runs on its own. On the Kinetic page (left rail) the pen works on a table's sample; the generated logic always reads the whole table.
The plan picture#
While you point and type, the pen draws the plan as a flow anyone can read: the source table, the fields you used, the step in plain words with its formula, and the result with sample values. For a total it also shows For each, for example for each region.
- Instant. The picture updates about half a second after you stop typing or pointing. Until you press Generate it is a dashed sketch. The sketch uses only the built-in rules, never the AI, so it costs nothing.
- Generated. After Generate the picture turns solid and matches the code and preview below it. Change the points or the text and it goes back to a sketch.
- Business words. When the table and columns have an approved meaning (Semantics → Meaning), the cards show it under each name, for example ship_date: Date the order left the warehouse.
- Share it. Copy puts the picture on the clipboard. PNG and SVG download it for a slide, an email or a ticket.
Read the sample values on the result card before inserting the code. They show at a glance whether the logic does what was meant.
Step by step#
In a notebook
- Run a cell. Its result grid has a Pen button next to the row count; press it. The pen panel opens above the grid and the grid switches to pointing: a click on a column header or a cell no longer sorts or selects, it adds a point.
- Point at the fields in the order you mean them. Each one gets an amber ring and its number (1, 2, …), and the same numbers appear as chips in the panel. Undo removes the last point, Clear removes all; Backspace and Esc work too.
- Say or type what you want, for example late if this is after this, call it is_late, and press Generate (or Enter). The microphone button records speech instead of typing; the words fill the box, where you can correct them before generating.
- Read the result card (a new column is placed after the business columns and before the audit trail columns; see chapter 10): the rule in plain words, Exact (worked out by the rules) or Suggested, check it (proposed by the assistant), the SQL and Python tabs, and a preview with the new column on the rows already on screen.
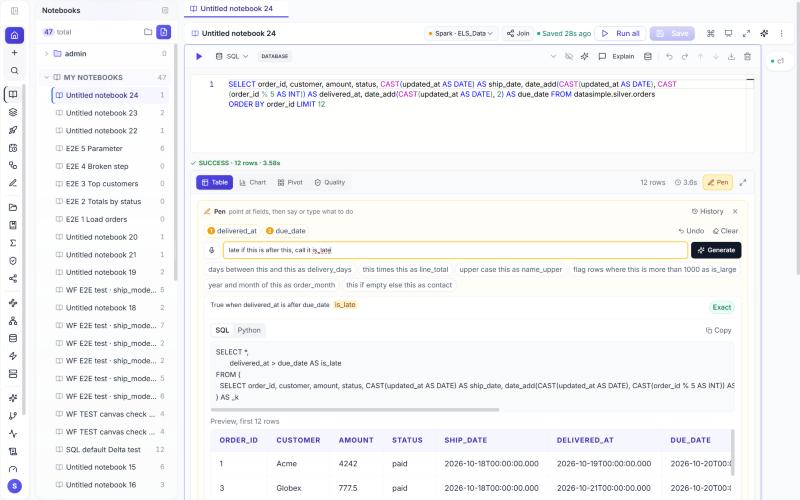
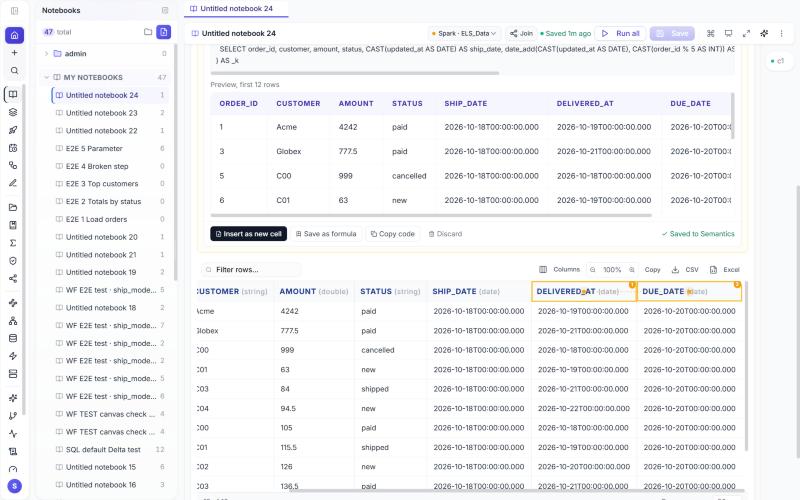
- Keep it in one of three ways:
- Save as formula opens a short form with the name and the plain-words description filled in; Save formula stores it in Semantics as a draft metric on the table. Every column the formula uses must be a column of that table; a column the cell's query computed (here
delivered_at,due_date) is refused with the reason, so save the query as a table first. - Insert as new cell puts the code in a new cell directly below, in the cell's language. It does not run until you run it.
- Copy code copies the active tab.
- Save as formula opens a short form with the name and the plain-words description filled in; Save formula stores it in Semantics as a draft metric on the table. Every column the formula uses must be a column of that table; a column the cell's query computed (here
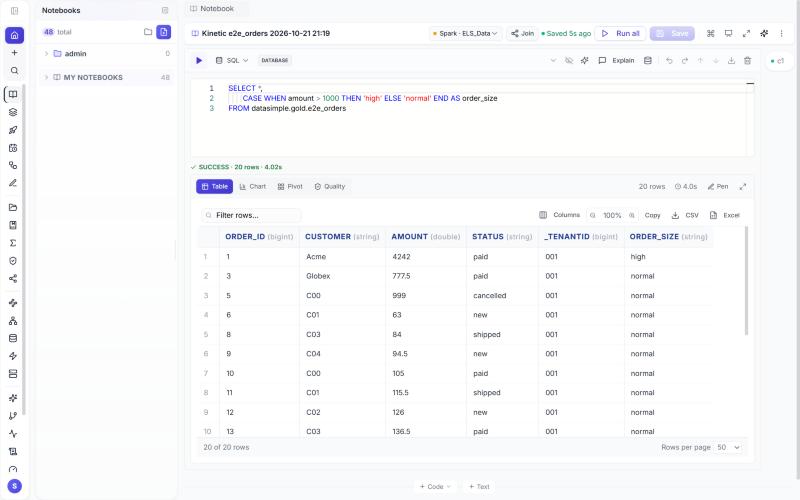
- Run the inserted cell. The result on the full data matches the preview.
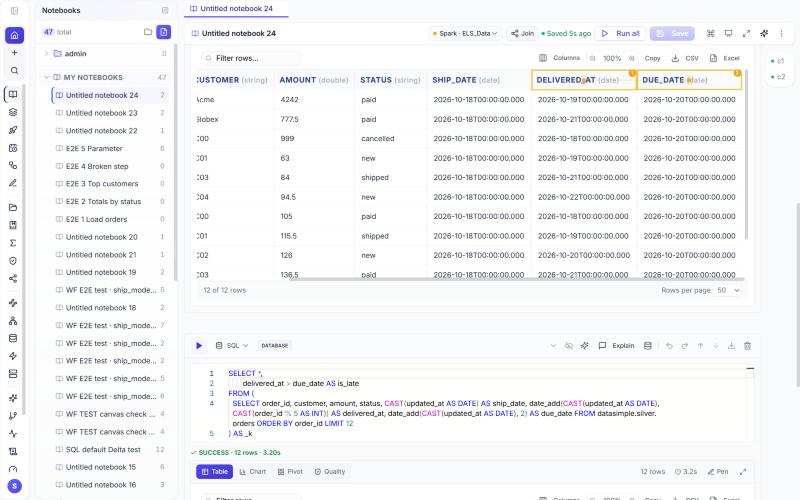
On the Kinetic page
- Left rail → Kinetic. Pick the layer at the top right and a table from the chips; its first 50 rows appear on the left with the pen already on. Point, say or type, and Generate as above. The code always reads the whole table (
FROM datasimple.<layer>.<table>,read_table("<layer>.<table>")), never just the sample. Open in a new notebook creates a notebook with the code in one cell and opens it; Recent logic below the panel lists what you made before, and a click loads it back.
Three ways to give the instruction
- Point and speak. Point while you talk. Each this / that / it / here goes to the column you pointed at nearest that moment, within 3 seconds. Otherwise the words go to the columns in the order you pointed.
- Point and type. Point at the columns, then type a short instruction ("minus", "days between", "total by"). Pointed columns fill in the gaps in pointing order. first / second mean the first or second column you pointed at.
- Speak or type only. Name the columns in the sentence. "ship date" or "delivered" is enough when it matches exactly one column.
A column that is not in the result is refused, and the message lists the columns you can use.
What you can say
| To get | Say | Result |
|---|---|---|
| Date difference | "days between this and this as delivery_days", "months between ship date and due date", "how long since this", "age in years" | datediff(delivered_at, ship_date), floor(months_between(…)) |
| Date plus / minus | "ship date plus 30 days", "this minus 2 weeks", "due date plus 1 month" | date_add(ship_date, 30), add_months(due_date, 1) |
| Yes / no flag | "late if delivered after due", "amount over 1000", "amount between 100 and 1000", "cost is null", "status contains 'ret'" | delivered_at > due_date |
| Labels | "if amount over 1000 then 'high' else 'normal'", "if amount over 1000 then high else if amount over 100 then medium else low call it band" | CASE WHEN … END |
| Arithmetic | "margin = price minus cost", "price times 1.2 call it gross price", "price as a percent of cost", "ratio of a to b" | price - cost. Division never fails on zero: it gives an empty value |
| Round | "round amount to 2 decimals", "round up this", "round to the nearest hundred" | round(amount, 2), ceil(amount) |
| Text | "upper case this", "trim status", "title case name" | upper(status) |
| Join text | "full name from first and last", "combine customer_id and order_id with a dash" | concat_ws(' ', first_name, last_name) |
| Totals | "total amount by customer", "average amount per region", "count by status", "number of distinct customers" | a GROUP BY query |
| Filter | "only paid", "where status is paid", "exclude rows where cost is null", "only this" (pointing at a cell) | a WHERE query |
Names. End with "call it X", "named X" or "as X", or start with "X = …" or "X if …". Without a name, the pen picks one from the columns, for example days_from_ship_date_to_delivered_at or is_amount_gt_1000. If the name already exists, a warning says the new value replaces it.
When the words don't match any of these patterns, the assistant may suggest a formula, marked Suggested by the assistant. It may use only the columns of the result and a short list of Spark functions. Anything else is refused: a second statement, a table name, a write, or an unknown name. Without the assistant configured, the pen answers "Could not understand" with an example sentence.
What is saved. Every result you generate is recorded with what you did with it (inserted, saved as formula, copied, discarded): the pointed fields, the instruction text, the rule and the code, under your user and tenant. History in the panel and Recent logic on the Kinetic page list them. Audio is never stored; only the words.
Nothing runs on the full data until you insert the code as a cell and run it, or save the formula and run it from Semantics. The preview uses only the sample rows on screen, at most 50.
POST /api/kinetic/generate     { context: { kind, table, sourceCode, sourceLanguage, columns, sampleRows }, pointers: [...], instruction: { text, words }, target }
POST /api/kinetic/transcribe   multipart field "audio" (webm / ogg / wav, up to 2 MB and 60 s) -> { text, words: [{ w, t }] }
POST /api/kinetic/sessions     GET /api/kinetic/sessions?limit=50     GET /api/kinetic/sessions/:id
POST /api/kinetic/formula      { name, expression_sql, table, description } -> { id, where: "Semantics" }
Everything#
Everything is the fourth tab at the top of the side panel, after Notebooks, Lakehouse and Data Lake. It opens a plain page with one box and the results under it. The Lakehouse tree stays in the side panel.
What Everything is for. Business people run the whole of DataSimple themselves, from one page and without code. Chapter 16 has the full picture: how a spoken request is handled, who may approve what, everything you can ask for, and a day with Sarah by voice from the morning brief to a deployment.
- Who it's for. Business users and managers, not engineers.
- What it replaces. Moving between Notebooks, Pipelines, the catalog, Governance, Schedules and Deploy. You say, type, point, draw or drop what you need instead.
- What it covers. From the moment data lands: see the data and what it means, load and shape it, secure it, schedule it, check its quality, answer questions with charts, watch for problems and move work to production. TODO.md lists what is built and what is still to come.
- How it stays safe. Answers are in business words and every number shows its proof. Every change waits for approval from someone with the role, and the AI never deletes anything (AI guardrail).
- The goal. Zero chaos: anyone in the business can understand their data and act on it without waiting for a developer.
Charts. Business answers come with charts drawn from the query results: KPI tiles with the change against the previous period, trend lines and areas, bars, donuts, current-vs-previous comparisons, heatmaps, maps and tables. Ask for a chart in words ("as a chart", "by month", "by region") or press Explain in detail. The chart is chosen from the shape of the data, not guessed: a line for data over time, bars for a ranking (top 10 plus Other), a donut only for a few parts of a whole, a heatmap for two categories, a scatter for two measures, a histogram for a spread, a waterfall for "why did it change", a funnel for stages. Each chart says why it was chosen, and What stands out lists the patterns found in the data. See Sarah, chapter 14.
Charts you can control. Every chart has the controls ELS Analyst has: Table / Chart, Line / Bar (for trends and bars), Labels and Legend, plus View source table (the rows behind it) and View sources and notes (the purpose, tables, metric and SQL). Say or type it too: show the labels, hide labels on all charts, make it a bar chart, switch to a line, show it as a table, back to the chart. A command acts on the chart you named or clicked, else the latest one; a full question (show sales by region as a bar chart) still goes to Sarah. An answer asked by voice, or released with show me, opens with its charts showing.
Scenarios (what-if). Say or type let's do a scenario, what if … or simulate … and a scenario panel opens, built from a Gold table that has a date column and a numeric measure (pick another table at the top). It is ELS Analyst's scenario engine: the stored baseline (the total or average of the measure), split into components by one text column (2–12 groups, the rest as All other values), plus a uniform % for all components. It shows the stored baseline, the scenario value, the change and the change in %, the running total by month with your scenario point, What moves the scenario?, presets (all components ±10%, the largest −20%), one slider per component, Solve for a target (by one component, or balanced across all) and Sources and assumptions (the formula and its limits). Talk to it: set GA to 8, increase Texas by 20 percent, what if West drops 10%, all components up 10 percent, solve for 40,000, reach 35 by changing GA, reset. It is arithmetic on stored values, never a forecast.
Talking to a scenario (AI control). Anything you say or type while a scenario is open is read the way ELS Analyst reads it. Exact phrases are applied at once (what would 40 look like previews a target, run the scenario to 40 applies it, apply the +10% preset, apply the target, export); other wording goes to TypeSafe, which only chooses among the controls on screen; if it is unsure, the AI model proposes the change. Every proposal is checked against the real components, ranges, presets and saved names before anything moves, and the reply always says what changed (or No values changed). A target is previewed first (Target preview … Apply / Discard) unless you said run or apply. Vague requests (make it bigger) get a question back, never a guess. The Control this scenario box under the numbers takes the same commands.
Saved scenarios. Saved scenarios keeps a named set of slider values for that table: Save current, then Load or Delete later (only the person who saved it, or an admin, deletes it); saving under the same name replaces it. By voice: save this as peak season, load the Q4 plan. Everyone in the tenant can load a saved scenario. Built at GET /api/everything/scenarios/build?table=gold.<table> as you, with your grants; the first build reads the table (up to a minute) and is reused for five minutes.
Activity. Activity at the top right opens one timeline of what was asked and what happened: each question or request with who answered it (Sarah or the agent), how it came in (typed, voice, a sample question, a file alert, a follow-up), whether it was answered, how long it took, the approvals it led to with who approved or rejected them, and the AI requests the guardrail refused. Open an item for the answer, the reason for a refusal, or a link to the full Sarah report. Filters: All, Sarah, Agent, Approvals, Refused, and Only from Everything (the Sarah and Agent tabs are listed too). You see your own activity; an administrator can switch to everyone's. It reads the records that already exist (sarah_reports, agent_runs / agent_actions, the audit log) through GET /api/everything/activity; voice small talk is not stored. Requests made before this existed show as from unknown.
What you can do by voice. With Let's talk on, everything you can type you can say: business questions, platform questions ("what failed last night?"), and requests such as granting access, scheduling, running a load or a pipeline. Small talk stays conversation. "Any update?", "show me", "later" and "stop reminding me" control the held answers. Three things stay on screen on purpose: Approve / Reject on a change (a person signs off with a click, never by voice), pointing and drawing with the Pen, and dragging a table for its summary.
- Ask about the business. For example Tell me today's sales. Sarah answers from the Gold layer.
- Ask about the platform. For example Who can see gold.customers? or What failed last night?. The agent answers from the catalog, loads, pipelines, quality and access.
- Who answered. The small icon on the result shows who answered. Ask the agent instead or Ask Sarah instead sends the same question to the other one. Start the question with
@sarahor@agentto choose.
The screen. Everything opens on a quiet page: the host's name and voice status on the left, the voice ring in the middle, and Show chat, a dark-mode switch, Persona & settings and Sample questions on the right. The middle says How's your day going? with Let's talk, Boss. →. Typing is optional; Show chat opens the text box. Persona & settings sets your name, the host's name (Sarah by default) and the host's persona, saved in this browser. Personality changes the wording, never the evidence.
Two kinds of live voice. When an administrator has set up live voice on the server, Everything hears and speaks at the same time, so you can talk over it. The key stays on the server. Without the key, or if OpenAI refuses the session, it uses the browser's own voice in Chrome or Edge.
Answers wait until you're ready. While voice is on, a finished answer is held off screen. Sarah offers it once, "Hey Boss, I've got the details you asked for. Want them now, or shall we keep chatting?", and a bar shows N answers ready · Show results. Say "yes", "show me now" or "pull it up" to see and hear it. Say "not now" or "keep chatting" to keep it for later, or "stop reminding me". "Any update?" tells you what is still running and what is ready. With TYPESAFE_API_KEY set, an independent check from TypeSafe confirms whether each sentence is conversation or a request for data, so small talk never starts a lookup and a data question never gets a made-up answer.
Talk to it. Press Let's talk or tap the voice ring to start live voice. It greets you and listens continuously. Every sentence you finish is asked straight away, and the answer is spoken back in one short sentence, for example "Net revenue today: 48.2 thousand dollars, up 9.3% on same time yesterday". A change it queued is announced as waiting for your approval on screen. The voice ring shows when it hears you and when it speaks. Stop talking cuts it off, Mute pauses the microphone, and End stops live voice. The browser's own speech service does the recognition.
Short answers first. A business answer is one sentence built from the numbers the queries returned, for example Net revenue today: $48.2K, up 9.3% on yesterday ($44.1K).
- Under the sentence. The page shows when the data was read, whether the figure is for today so far, and which definition was used. That is either an approved metric, a metric that is not approved, or no metric at all.
- Today is compared like for like. Today so far is compared with yesterday up to the same time of day, for example 00:00 to 14:30 on both days. That needs a table with a time of day, a timestamp column. When the table only has a date, the answer says "compared with all of yesterday" and warns that the change will look lower until the day ends. DataSimple checks the SQL that actually ran, so the label is always true.
- More detail. Explain in detail shows the KPI tiles, charts and insights. Asking for detail in the question, with words like explain, breakdown, why or chart, opens it straight away.
- Proof. Proof lists every query with its SQL. Re-run that SQL on the Gold table and you get the same number.
Favourites. The items you starred in the left menu appear as folders in the side panel, under the Lakehouse tree. Click one to open it.
New files in S3. When a new file lands in a watched S3 folder, a one-line alert appears under the box, for example New orders file arrived · Load it into Bronze?. Load asks the agent to load it, which needs your approval. Dismiss clears it.
- What is watched. The landing folders of DataBridge file sources, catalog volumes and external locations. Files already there when watching starts never alert, and Spark output, Delta logs and temporary files are ignored.
- Turning it on. An administrator sets
FILE_ALERTS_ENABLE=true.FILE_ALERT_PREFIXESwithFILE_ALERT_TENANTadd extra folders, andFILE_ALERT_INTERVAL_MSsets how often it checks (default every minute).
Drag a table for its business summary. Drag a table from the Lakehouse tree onto the Everything page. A card answers in one sentence from the data, for example 20 rows, total amount 8K. Top status: paid (5.6K). Under it are the facts a business user asks first: how fresh it is, whether quality checks pass, its keys, where it comes from and what it feeds, and its size. Ask about it, Point at the data and Open in notebook take it further, and Proof shows the two queries, run with your access.
Point at the data with the Pen. Click a table in the Lakehouse tree while Everything is open, and its first rows appear on the page instead of in a notebook. Turn on Pen on the grid, point at the columns you mean, and say or type what you need, for example days between this and this as delivery_days. The plan picture and the code appear under the grid.
Development continues in Notebooks. Open in notebook puts the code into a notebook cell and switches to Notebooks: into the open notebook, or a new one when none is open. It's on the Pen's result, on a table preview, and next to every query under Proof. Inserting a table from the tree also switches to Notebooks.
Changes wait for you. When the agent wants to change something, such as granting access, running a pipeline or writing data, it shows a Needs your approval card. Nothing changes until you press Approve. Reject leaves everything as it was.
Build pipelines from what you say. Everything builds saved objects you can open on the Pipelines and Workflows screens; each one waits for your approval and is saved, not run.
- Load the orders and customers tables from our SQL Server into Silver and Gold every day at 6 → a Workflow (Connection → Bronze → Silver → Gold, with keys, filters, totals, PII masks, checks and grants), built by the same builder as the Workflows screen, and, when you give a time, a scheduled pipeline for it.
- Create a pipeline "Daily region revenue": run the Load orders notebook, then keep a Gold total by region up to date, every day at 6 → a Pipeline: existing notebooks as steps (found by name), new SQL steps put in new notebooks, and the order between them. A summary that must be rebuilt each run becomes a materialized view: a step creates it, a step refreshes it.
- New SQL steps go through the AI guardrail when proposed and again when saved: they may read, add, update, merge and create new tables, never drop, delete, truncate, alter, overwrite or replace. Only SQL is written, never Python, so a schedule cannot carry a hidden change.
- A step that runs a notebook whose code drops or deletes is marked Contains destructive steps on the card.
Star schema and One Big Table. Build a star schema for the orders in silver.shop_orders, with a customer dimension that keeps history, and a One Big Table drafts the fact, its grain and measures, and its dimensions from the catalog. The approval card draws the plan. Approve, and it saves a DS Tables notebook and a pipeline that builds it; every table must be a new name. See chapter 15, Star schema and One Big Table.
Morning brief and "what failed last night?" The Everything page opens with a Morning brief: what failed in the last 24 hours (pipelines, scheduled notebooks, workflows, DataBridge loads, materialized views) with the reason, open data-quality alerts, stale tables and approvals waiting. Only the latest run of each thing counts: something that failed and has since run fine is not listed. Each failure has Rerun (the object's own run, as you, with your permissions) and Why? (the agent explains the error and how to fix it). Dismiss the card and it stays away until tomorrow. Ask what failed last night? or brief me by voice or typing for the same list; rerun the sales pipeline shows an approval card.
Metrics, terms and quality rules. Define a metric Net order value …, approve it shows a card with the SQL and the value it gives today; approving a definition needs a data steward or an admin, and Sarah then uses it. Amount must not be negative on silver.orders, make it an Error adds a quality rule, tried on the real table before it is saved and then reviewed by a second person; run the checks on silver.orders, can we certify gold.sales? and certify it follow. See chapter 16.
Deploy from Everything. What is ready to go to QA? lists what is new and changed against QA (or Prod). Deploy the daily sales pipeline to QA shows a card with a dry run (what would move, and anything missing on the target); only an administrator can approve it. A deploy never forces past missing Data Sources or tables; it stops and says what is missing. New schedules and pipelines arrive disabled on the target. Workflows deploy like other objects (chapter 12).
Spark status#
The notebook header shows how your Spark session is doing. Spark: starting… 12 s counts up while it starts (about 30 to 40 seconds); the first Python or write cell you run waits for it, while read queries on lake tables answer straight away from the always-on SQL engine when it is running. Spark: ready means cells start at once. Nothing is shown when no session is running and none is starting. The application starts your session as soon as you sign in, so it is usually ready by the time you open a notebook. Hover the chip for the same explanation.
Sharing Spark sessions#
Only a few Spark sessions can run at once on the server, so they are shared fairly:
- Your own limit. You can have a set number of notebook sessions open at once (your administrator sets it; by default half of the server's sessions). Opening one more closes your own session that you used least recently, not someone else's.
- When the server is full, the session closed first is an idle one belonging to someone using more than their share, and otherwise the one that has been idle the longest. A session that is running a cell is never closed.
- When every session is busy, your run waits a few seconds and then says All Spark sessions are busy; try again in a minute. Nothing is stopped to make room.
- If your session was closed while you were away, the next cell you run shows Spark session restarted with the reason, for example Your Spark session was restarted to free capacity for others (idle 25 min). Variables from earlier cells need to be re-run. Run the earlier cells again (or Run all) to get your variables back. Saved tables are not affected.
Administrators: the settings are in Monitoring and admin, section 7.
The run log#
Log (left rail) has one line per cell run: source, steps, status, duration, rows, error text, with filters for notebook, errors only and origin (interactive, scheduled, Dataflow). Click a line to open the notebook at that cell. History has every action (created, run, scheduled, deleted). The notebook menu's Audit log… is one notebook's full timeline. More in 11. Monitoring.
Read more#
- Quick start: Work in notebooks.
- PySpark: https://spark.apache.org/docs/latest/api/python/ · Spark SQL: https://spark.apache.org/docs/latest/sql-ref.html
- Delta time travel: https://docs.delta.io/latest/delta-batch.html#query-an-older-snapshot-of-a-table-time-travel