Overview#
DataSimple records what happens in your workspace and shows it on five screens, each answering one question:
| Screen | Question |
|---|---|
| Lineage | Which tables feed this table, and what does it feed? |
| History | Who did what, when, with what outcome? |
| Log | What ran, how long did each step take, did it fail? |
| Ingestion (administrators only) | How are DataBridge jobs doing: tables, memory, log? |
| Usage | How much compute, rows and storage did each layer, table, job and user use? |
There is also an object history of every CREATE, ALTER, DROP and write, with full text (see Lakehouse and governance), and a request-level Activity Logs trail for administrators on the Ingestion screen.
Everything is scoped to your tenant. The one exception: a platform administrator's Activity Logs and Error Logs cover all tenants. Recording is best effort: a failure to record an event never fails the work it describes. See Architecture for where these sit in the platform.
Key concepts#
| Term | Meaning |
|---|---|
| Lineage edge | A link from a source table to a target table, with the job, notebook, run, user and time that produced it. There is one edge per source and target; a re-run refreshes the edge rather than adding a new one. |
| Node reference | A normalized table name. datasimple.gold.x, gold.x and gold/x are the same node, shown as gold/x. Non-lake sources keep a prefix: pg:<table>, file:<name>, external:<engine>:<connection>:<schema.table>. |
| Producer entry | A self-entry (source = target) that records which notebook produced a table, even when the table has no upstream source. The graph does not draw it as an edge. |
| Job | What made an edge: cell, schedule, pipeline, ingest, join, ds, dbt, workflow:<name>, databridge:<job id>. |
| Audit entry | One History entry: action (<resource>.<verb>), resource type and id, status ok or error, error, IP address, user agent, and where the request came from (ui, cli, mcp, api or scheduler; any other value is recorded as unknown), plus the personal token id when one was used. |
| Run log entry | One entry per cell run, scheduled cell, pipeline cell, Dataflow cell, CLI or API cell run, or DataBridge job: status, total time, row count, error, code and a trace of timed steps. Interactive runs keep the first 4,000 characters of code. Scheduled and pipeline cells keep up to 20,000 characters; their trace records only where the run came from. |
| Trace step | { step, ms?, detail?, depth? }. For a DataBridge job, one step per table with its read, copy, change log and catalog times. |
| Query id | Q-<id>. Notebook and cell codes are NB-<id> and NB-<id>-C-<prefix>. All of them are searchable in Query History. |
| Usage entry | One unit of work of kind databridge_job, bronze_apply, silver_apply, notebook_cell, pipeline_step, schedule_run, dataflow_run or storage_scan, measured in milliseconds, rows, bytes and Spark seconds. |
How it works#
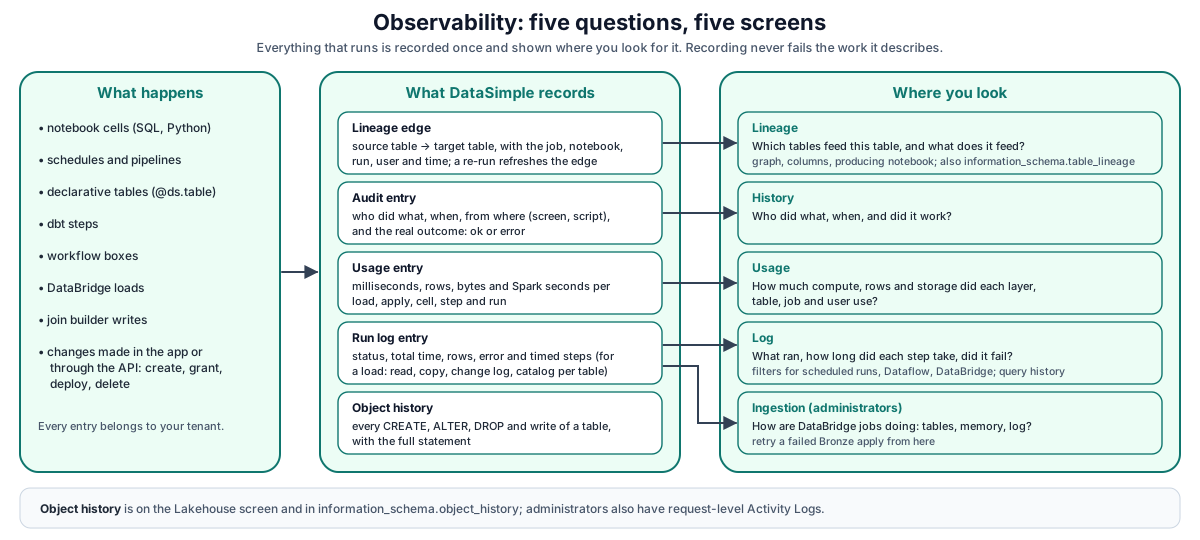
Walk-through:
- A notebook cell runs. DataSimple records lineage (from the code and from the tables the session actually wrote), an object history entry for any DDL or write, a run log entry with timed trace steps, a History entry (
notebook.spark_run) and a usage entry. - Schedules and pipelines write their own run log entries (with a run id such as
pipeline-15-run-79) and lineage with jobscheduleorpipeline. - When a DataBridge job finishes, DataSimple records one run log entry and one History entry for the job, lineage for every table that landed, and its usage.
- Each screen shows your tenant's entries.
Lineage#
Where edges come from
| Producer | Job | How |
|---|---|---|
SQL cell (CREATE TABLE AS, INSERT, MERGE) |
cell |
Sources and target read from the SQL |
Python cell (save_table, write_delta, merge_delta, saveAsTable) |
cell |
Read from the code plus the tables the session reports writing; a producer entry ties the table to the notebook |
| Scheduled notebook / pipeline cell | schedule / pipeline |
Same as cells |
@ds.table run |
ds |
The tables each declared function read |
| dbt step | dbt |
Edges from the dbt project's model dependencies |
| Workflow box | workflow:<name> |
Upstream box (or source connection) to the box's table |
| Join builder with a write target | join |
Every join source to the target |
| Postgres table ingest | ingest |
pg:<table> to the Delta table |
| DataBridge job | databridge:<job id> |
external:<engine>:<connection>:<table> to the source-layer copies (Parquet, Delta, Iceberg); the Delta copy to Bronze; the copy to Silver; Silver to its history table |
Every reference is normalized, and no edge links a table to itself. The single-table lineage API (/spark/lineage) can still list the table's own producer entry among its upstream and downstream rows.
Reading lineage
| Method | Path | Purpose |
|---|---|---|
| GET | /api/notebooks/lineage-graph |
Your whole graph: nodes, edges, producing notebook per table. Used by the Lineage screen. |
| GET | /api/notebooks/spark/lineage?table= |
Upstream and downstream of one table, with job and time |
| GET | /api/notebooks/spark/column-lineage?table= |
Column mapping from each direct source, inferred by column name (case-insensitive). Not parsed from expressions. |
| GET | /api/notebooks/lineage?match=&ids= |
Notebook-level read/write map read from cell code (nothing is run). Used by the Dataflow canvas. Reports dynamic names it could not resolve. |
| SQL | SELECT * FROM datasimple.information_schema.table_lineage |
The same edges as a standard view: source_table, target_table, job, notebook_id, run_id, recorded_at |
The Lineage screen draws the graph and lets you focus a table to see its columns, column lineage and the producing notebook.
History#
History records one entry per action, with its real outcome. A Spark cell that fails is recorded with status error. Actions include notebook.create, schedule.run_now, connection.query, notebook.spark_run, notebook.git_commit and others, plus module actions such as semantic.*, sharing.* and databridge.job_done / databridge.job_failed.
| Method | Path | Purpose |
|---|---|---|
| GET | /api/notebooks/activity?group=&status=&user_id=&from=&to= |
History screen feed. group: run, edit, schedule, connection, file, databridge. Administrators see the whole tenant; others see only their own actions. |
| GET | /api/notebooks/audit-log?action=&resource_type=&resource_id=&from=&to= |
Audit entries. Non-administrators see either one notebook they can read (all users' actions on it) or only their own actions. |
The History screen links a run entry to its row in Query History by run id.
Administrators also have the Activity Logs and Error Logs sub-tabs on the Ingestion screen. Activity Logs is a request-level trail of changes made through the app. Error Logs lists the History entries that failed. Some changes therefore appear both in History and in Activity Logs.
Log (run log and query history)#
The Log screen has two views: Query History and Run log.
Run log entries come from interactive cell runs, scheduled and pipeline cells, Dataflow runs, cell runs from the CLI or the API, and DataBridge jobs (one entry per job, run id databridge:job:<id>, source databridge).
An interactive entry holds up to 500 timed steps. A DataBridge entry has one step per table. Its trace starts with an origin step, then a header step (DataBridge load · <source> · N tables, total time, engine and kind), then one step per source table. A table whose status is not ok is marked with its status, for example [failed] orders. Each table step's detail reads like this:
120,000 rows · parquet/delta · bronze 120,000 rows · silver +1,200 ~300 -15 · read 2.1 s, copy 4.8 s, change log 3.0 s, catalog 0.4 s
The silver part (rows inserted, updated and deleted) appears only when the job applied the table to Silver.
The four step times (read, copy, change_log, catalog) are the same times shown on the DataBridge job. They show which step of a load is slow. See DataBridge.
| Method | Path | Purpose |
|---|---|---|
| GET | /api/notebooks/run-log?notebookId=&before=&mine=1&status=error|ok&limit= |
Run log entries, newest first (max 300). Cell code is returned as written. Errors, traces and sources hide storage locations, internal addresses and personal tokens. |
| DELETE | /api/notebooks/run-log?notebookId= |
Clear one notebook's log (needs edit access), or the whole tenant's log (administrators only) |
| GET | /api/notebooks/query-history?q=&mine=1&local=1&status=¬ebookId=&from=&to=&hash=&before=&limit= |
Query History list with summary (total, failed, time, rows, notebooks) and cursor paging. Non-administrators see only their own entries. mine=1 limits administrators to their own entries too. local=1 also includes your database SQL runs. |
| GET | /api/notebooks/query-history/:id |
One query (Q-123 or 123): full code, error, steps, lineage of that run, profile, and all executions of the same code with p50, p90 and p99 times |
Search (q) understands Q-<id>, NB-<id>[-C-<cell>], run ids, and free text over code, run id, notebook name, cell, source and user name.
Retention: the run log keeps the newest 1,000 entries per tenant by default. The number is a platform setting (at least 100) and cannot be changed in the app. Older entries are copied to the log archive and then removed from the screen; without a log archive they are kept.
Ingestion monitor#
The Ingestion screen is shown to administrators only. It has three sub-tabs:
- Ingestion Jobs shows every DataBridge job with its tables, report, memory use and log. From here you can re-run, cancel and retry Bronze for a job. A table that read nothing shows Zero data extract under its row count; its details show the run's note and, for a change-log run, the changes read (inserted I, updated U, deleted D).
- Activity Logs is a request-level trail of changes made through the app.
- Error Logs lists the History entries that failed.
The DataBridge page's Load History shows the same jobs. See DataBridge.
Usage#
DataSimple records one usage entry per unit of work: notebook cells, pipeline steps, schedule runs, Dataflow runs, DataBridge jobs and Bronze and Silver applies. A storage scan measures the size and file count of each table.
| Method | Path | Purpose |
|---|---|---|
| GET | /api/usage/summary?from=&to=&group= |
Totals per tenant, layer, table, job, user, kind or day, with the previous window for comparison |
| GET | /api/usage/rows?from=&to=&kind=&table=&limit= |
Individual usage entries |
| GET | /api/usage/storage |
Measured size and file count per table |
| POST | /api/usage/storage/scan |
Run the storage scan now (administrators) |
| GET | /api/usage/export.csv?from=&to=&group= |
Summary as CSV |
Units only. Usage is reported in time, rows, bytes, Spark seconds and storage size. Monetary amounts are not shown.
Log archive#
No log entry is lost. Every log, audit and run-history table (run log, query history, scheduler and pipeline runs, Dataflow runs, data-quality results, governance audit, sign-in history, agent and Sarah conversations, usage, sharing access, Kinetic recordings and more) is copied to a dedicated archive bucket:
- Before anything is removed. When a table trims its oldest entries (run log, query history, run history, notebook versions, deploy history, CPU samples), or a person clears a list (Clear history, a deleted Kinetic recording or Sarah report, a quarantine purge), the entries are written to the archive and removed in one step. If the copy fails, nothing is removed.
- Every night. The entries added since the last night are copied, also for the tables that are never trimmed. One app server does it at a time.
- Outside the database. A nightly job copies the DataBridge database (load history, positions, Bronze applies), the new part of the DataBridge log files, and the Dataflow task logs.
The archive bucket keeps every file: versioning and Object Lock in governance mode protect it from deletion and changes, and files move to cheaper storage over time (Glacier Instant Retrieval after 30 days, Deep Archive after 180 days). Files are compressed JSON lines, one folder per table and day, so they can be read with Athena or any JSON reader.
Without a log archive configured, the automatic trims are skipped (entries are kept); a list a person clears is still cleared.
Object history#
Every CREATE, REPLACE, ALTER, DROP, RENAME and write is recorded with its full text, method, user and run. It feeds information_schema.tables (created, last altered), information_schema.object_history and the Lakehouse object history. See Lakehouse and governance.
Developer examples#
1. Upstream and downstream of a table in SQL#
-- What feeds gold.sales_by_region, and from which job?
SELECT source_table, job, notebook_id, run_id, recorded_at
FROM datasimple.information_schema.table_lineage
WHERE target_table = 'gold/sales_by_region'
ORDER BY recorded_at DESC;

-- What breaks if silver.orders changes?
SELECT target_table, job
FROM datasimple.information_schema.table_lineage
WHERE source_table = 'silver/orders' AND target_table <> source_table;
References are in normalized form (gold/sales_by_region). The <> filter skips producer self-entries.
2. One table's lineage over HTTP#
curl -s "https://<your-datasimple-host>/api/notebooks/spark/lineage?table=gold.sales_by_region" \
  -H "Authorization: Bearer <PERSONAL_TOKEN>"
{
  "success": true,
  "table": "gold/sales_by_region",
  "upstream":   [{ "ref": "silver/orders", "job": "pipeline", "at": "2026-10-27T09:12:03.000Z" }],
  "downstream": []
}
3. Find failed runs and open one#
AUTH="Authorization: Bearer <PERSONAL_TOKEN>"
BASE=https://<your-datasimple-host>/api/notebooks

curl -s -H "$AUTH" "$BASE/query-history?status=error&limit=20"
# { "summary": { "total", "failed", "total_ms", "rows", "notebooks" },
#   "queries": [ { "query_id": "Q-5123", "run_id": "...", "notebook_code": "...", ... } ] }

curl -s -H "$AUTH" "$BASE/query-history/Q-5123"
# { "query": { "code", "error", "steps", ... }, "metrics": { "p50_ms", "p90_ms", "p99_ms" }, "lineage": [...] }
4. DataBridge step times and usage for the last day#
# DataBridge jobs in the run log (trace = per-table read/copy/change log/catalog)
curl -s "https://<your-datasimple-host>/api/notebooks/query-history?q=databridge&limit=10" \
  -H "Authorization: Bearer <PERSONAL_TOKEN>"

# Usage by job for a window, as CSV
curl -s "https://<your-datasimple-host>/api/usage/export.csv?from=2026-10-27&to=2026-10-28&group=job" \
  -H "Authorization: Bearer <PERSONAL_TOKEN>" -o usage-by-job.csv
Security and permissions#
- Tenant isolation. Every screen and API returns your tenant's entries only. The exception is a platform administrator, whose Activity Logs and Error Logs cover all tenants.
- Tab access. The whole-graph
/lineage-graphAPI needs the Lineage tab. The notebook-level/lineagemap needs the Lineage or Dataflow tab. Single-table lineage and column lineage need the Notebooks tab. The History feed needs the History tab. The audit-log API needs the Notebooks tab. Query History needs the Log or Notebooks tab. Reading or clearing the run log needs the Log tab. Usage needs the Usage tab. See App server and security. - Own entries only for non-administrators in History, the audit log and Query History, except a shared notebook's audit history.
- Redaction. Run log and query history responses return cell code as written. Errors, traces and sources hide storage locations, internal addresses and personal tokens. Keep passwords and keys out of cell code; use connections instead.
- Clearing logs. Clearing one notebook's run log needs edit access. Clearing the whole tenant's log needs an administrator.
- Request origin. History records whether a request came from the browser (
ui), the CLI (cli), an AI tool (mcp), the API (api) or a schedule (scheduler), otherwiseunknown, and which personal token was used (its id, never the token). This is a label only and is never used for permission decisions.
Monitoring and troubleshooting#
| Symptom | Likely cause |
|---|---|
| A table has no lineage | It was written with a dynamic name (an f-string), or in a way DataSimple cannot read from the code. The notebook-level /lineage reports a dynamicRefs count. |
| The same table appears as two nodes | One reference uses a storage path instead of a table name. Use schema.table names. |
| A loop from a table to itself | A notebook that creates a table and then runs INSERT OVERWRITE into it shows a self-edge next to the real edge. It can be ignored. |
| A DataBridge job is missing from Log or History | The job is still running. Finished jobs always appear in Ingestion and Load History; if one is missing from Log, contact your administrator. |
| An action appears in both History and Activity Logs | Expected: both record many changes. |
| Old runs are gone | Run log retention removed them from the screen; they are in the log archive. |
| Usage shows no amounts | By design; Usage reports units, not money. |
Limits#
- Column lineage is name-based. Renamed or computed columns are not traced.
- Edges are latest-only. An edge keeps only the most recent job, run and time. Earlier runs that used the same edge are not kept.
- Self-edge after create-then-overwrite in one notebook (see above).
CREATE TABLE IF NOT EXISTSthat changes nothing is recorded again as CREATE in the object history.- Run log retention is a number of entries per tenant (1,000 by default, set for the platform and not changeable in the app), not a time window. Removed entries are in the log archive.
- The run log API returns at most 300 entries per call.
Related content#
- Lakehouse and governance: object history,
information_schema, UC audit - DataBridge: Load History, step times
- Pipelines, Schedules and scheduler, dbt
- Data quality
- Workspace and administration: Activity Logs, roles, tab access
- Reference
- Unity Catalog (OSS): https://docs.unitycatalog.io/